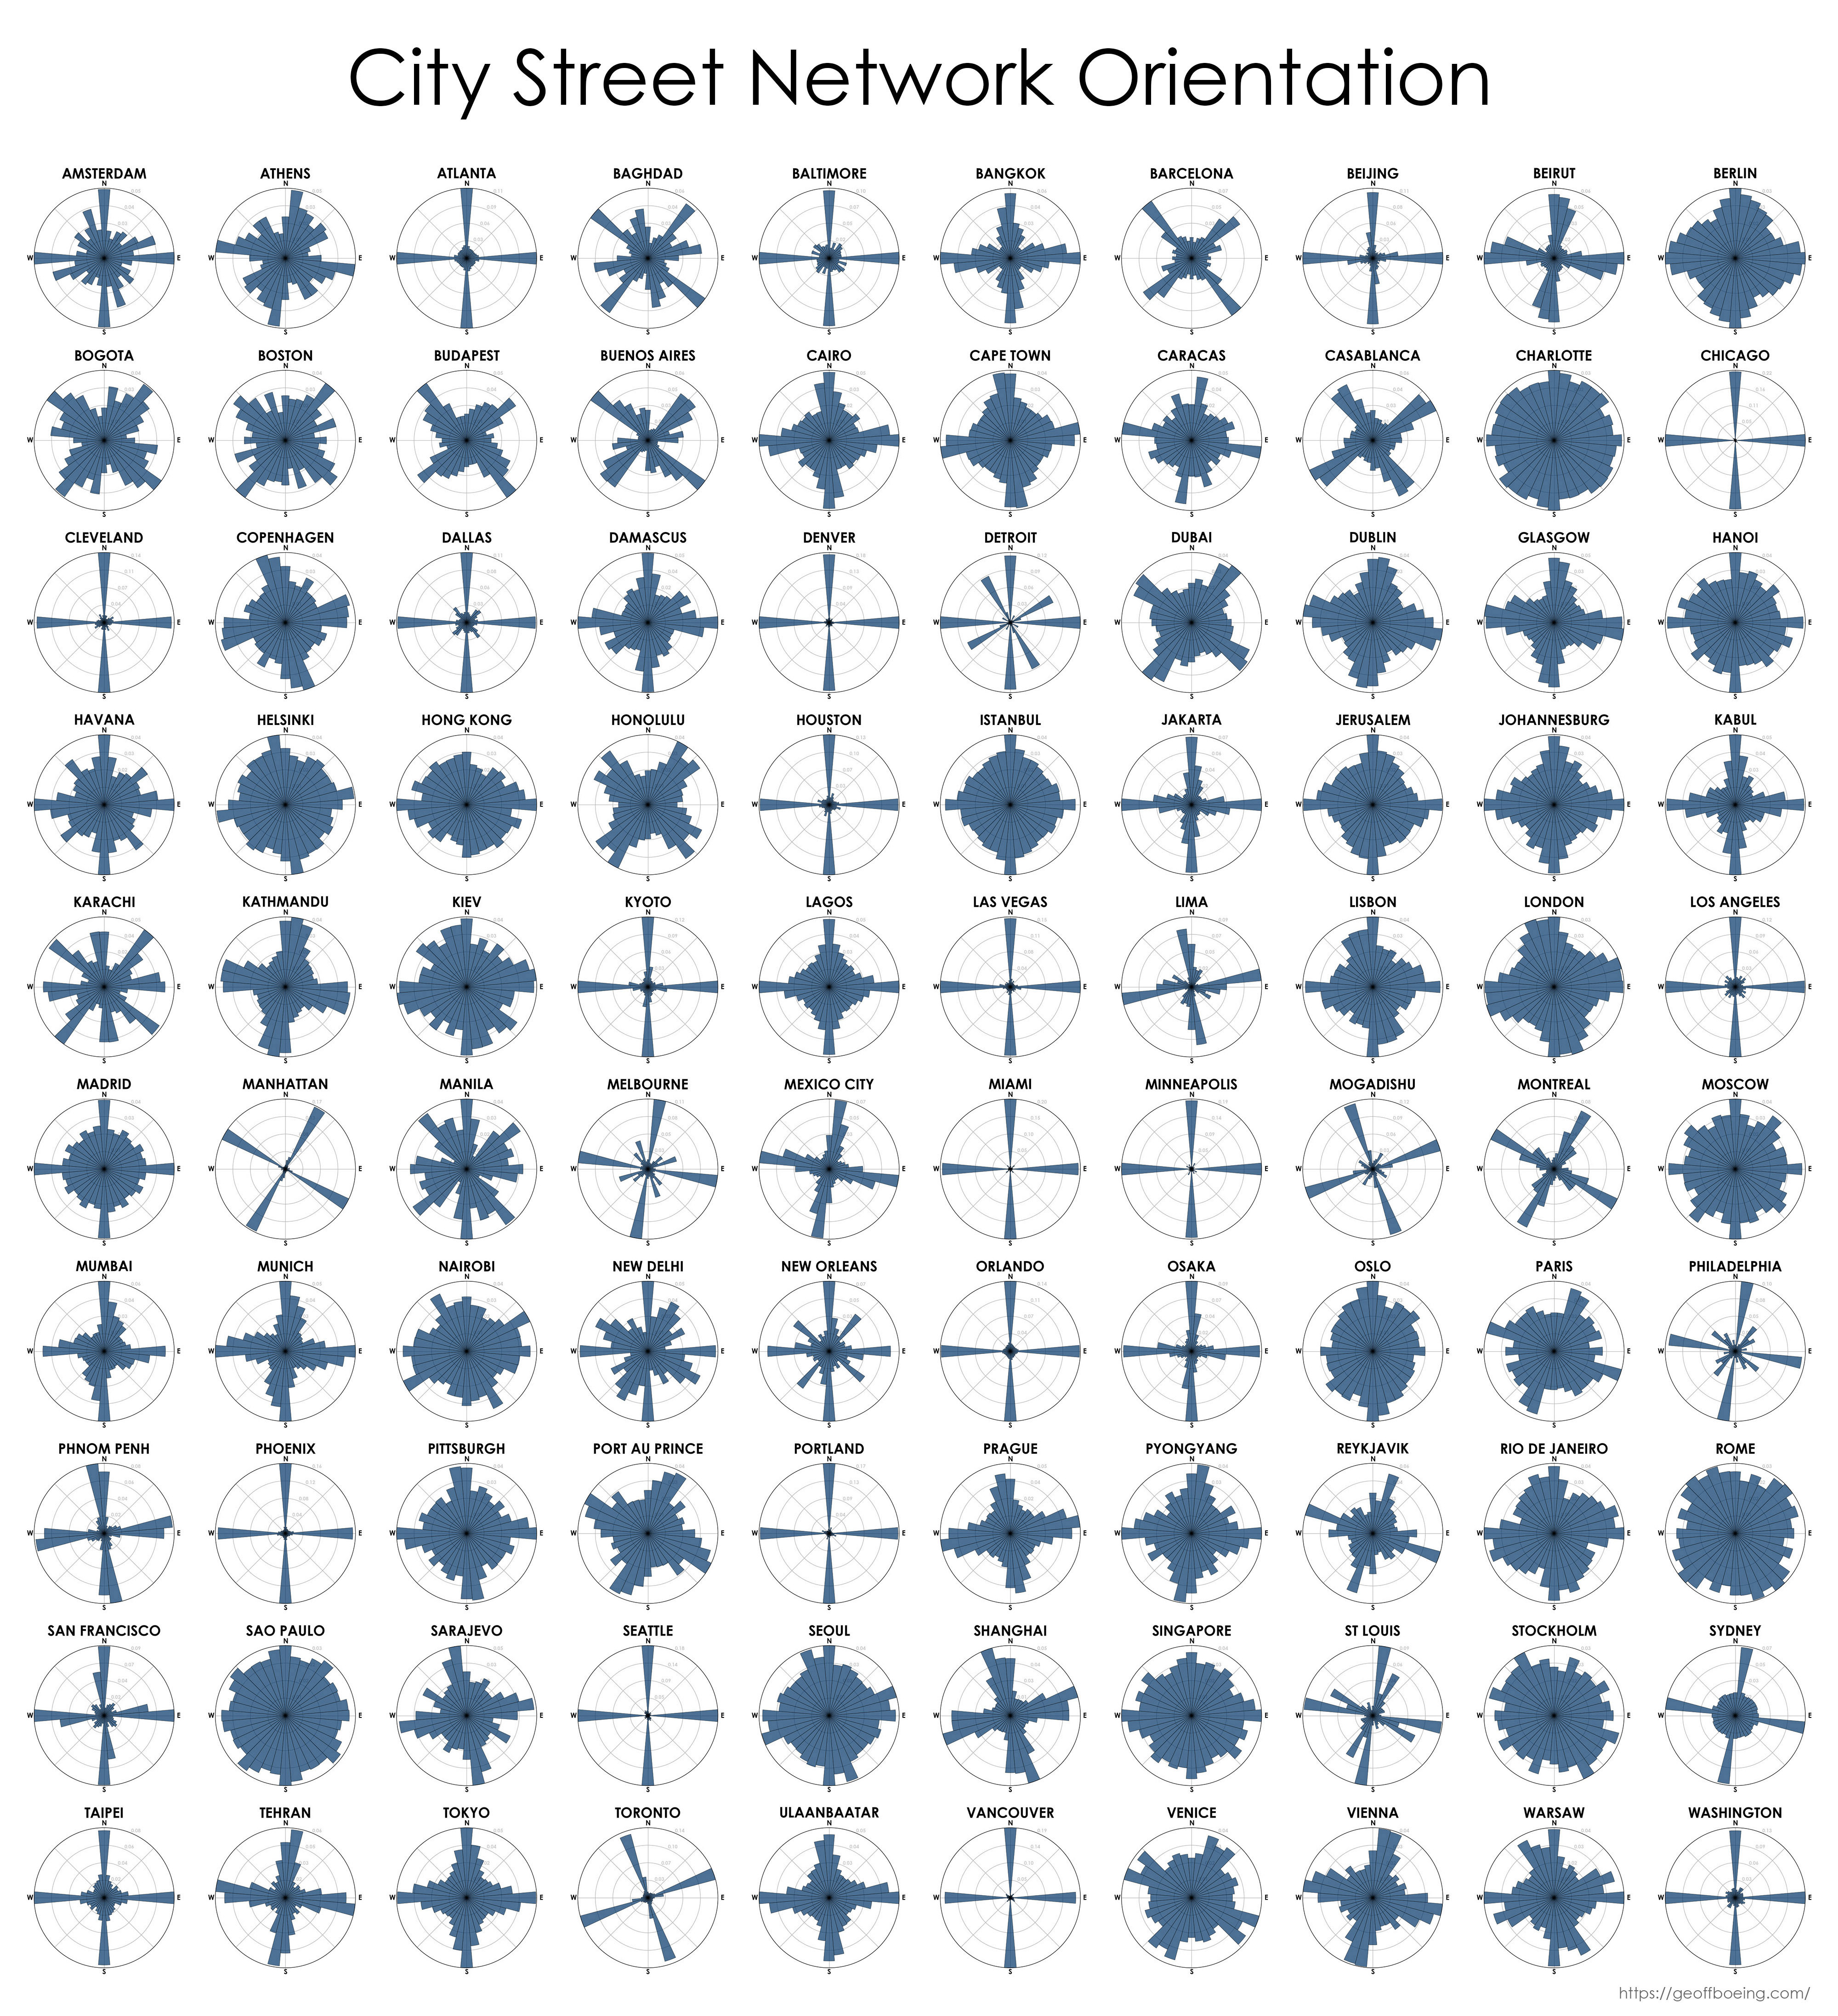
I might be a moron here, but I have no idea how to interpret this. Is each blue bar the proportion of streets that run in that direction? Do the ones that just have a single bar at N/E/S/W have perfectly aligned streets that only go in the cardinal directions?
Seattle too has a section that’s perfectly n/s. It was built upon infill created by destroying larger hills, flattening the city and filling in the bays. The older city is canted off at a strange angle, you can see the streets change directions at denny way near downtown.
Outside the downtown corridor everything is aligned NS iirc.
Also, how is the direction assigned? Especially for streets that are not straight? For example taking a beginning and end and measuring their angle wouldn’t be very representative. And how does it work with long and short streets? Are longer more heavily represented, or do they count the same? I’d like it if it took a tangent to the street every 100 m or so, but somehow I doubt that’s what they did.
This might not be the best representation if you’re trying to depict “good” cities. Madrid is famous for having a very centrally planned and carefully considered grid, and yet the graph here looks like a mess.


I might be a moron here, but I have no idea how to interpret this. Is each blue bar the proportion of streets that run in that direction? Do the ones that just have a single bar at N/E/S/W have perfectly aligned streets that only go in the cardinal directions?
Here’s a portion of detroit:
The city is almost entirely grid, some of it at an angle. You can see these two grids visualized in the post.
Seattle too has a section that’s perfectly n/s. It was built upon infill created by destroying larger hills, flattening the city and filling in the bays. The older city is canted off at a strange angle, you can see the streets change directions at denny way near downtown.
Outside the downtown corridor everything is aligned NS iirc.
That’s my interpretation too.
Newer cities tend to be more grid like. Older European cities tend not to follow a grid.
Also, how is the direction assigned? Especially for streets that are not straight? For example taking a beginning and end and measuring their angle wouldn’t be very representative. And how does it work with long and short streets? Are longer more heavily represented, or do they count the same? I’d like it if it took a tangent to the street every 100 m or so, but somehow I doubt that’s what they did.
I had presumed it’s the angles of the intersections.
So basically angles of ends of streets. Well, there are many options and we just don’t know which one it is.
This might not be the best representation if you’re trying to depict “good” cities. Madrid is famous for having a very centrally planned and carefully considered grid, and yet the graph here looks like a mess.